My team has recently been working to migrate documents from a local store to S3, which runs for 12+ hours. We wanted to put together a dashboard to show the product team the current status of the migration.
Since we already had a Prometheus and Grafana deployment, it made sense to use that. However, we didn't want to spend time to add code to our app to define additional metrics. Fortunately, query-exporter makes this super easy!
Quick Example
With the following config, I will expose the number of documents as a document_count metric with a label to indicate the storage_provider.
databases:
  db:
    dsn: postgres://user@pass:localhost:5432/db

metrics:
  document_count:
    type: gauge
    description: Number of documents by storage provider
    labels: [storage_provider]

queries:
  query1:
    interval: 5
    databases: [db]
    metrics: [document_count]
    sql: >
      SELECT storage_provider, count(*) as document_count
        FROM documents
        GROUP BY storage_provider
If my table had two storage types (AWS and local), we would see metrics like this:
# HELP document_count Number of documents by storage provider
# TYPE document_count gauge
document_count{database="db",storage_provider="aws"} 2959.0
document_count{database="db",storage_provider="local"} 117923.0
Securely Configuring the Connection
Rather than hard-coding the database credentials into the config file, we created a small bootstrap script that is run when the container starts. It reads a SECRET_ID environment variable and pulls the details from the AWS Secrets Manager.
#!/bin/sh

set -e

echo "Using secret with id $SECRET_ID"

SECRET=$(aws secretsmanager get-secret-value --secret-id "$SECRET_ID" --query SecretString)
eval secret="$SECRET"

if [ -z "$PGHOST" ]; then
  export PGHOST=$(echo $secret | jq -r .host)
fi
if [ -z "$PGPORT" ]; then
  export PGPORT=$(echo $secret | jq -r .port)
fi
export PGDATABASE=$(echo $secret | jq -r .dbname)
export PGUSER=$(echo $secret | jq -r .username)
export PGPASSWORD=$(echo $secret | jq -r .password)

export CONNECTION_STRING=postgres://${PGUSER}:${PGPASSWORD}@${PGHOST}:${PGPORT}/${PGDATABASE}

echo "Starting query-exporter by connecting to $PGHOST"
query-exporter config.yml -H 0.0.0.0
Once the environment variable is defined, the value can be pulled by query-exporter by specifying the value in the config:
databases:
  db:
    dsn: env:CONNECTION_STRING
The Dockerfile
Since we do everything in containers, we needed to build an image! Since query-exporter is Python-based and we needed the AWS cli, we decided to use my mikesir87/aws-cli image. We had to install musl-dev and gcc in order for SQLAlchemy to install and compile. Once installed, we remove those dependencies.
FROM mikesir87/aws-cli

RUN apk add --no-cache musl-dev gcc postgresql-dev && \
    pip install query_exporter SQLAlchemy[postgresql] && \
    apk del --purge musl-dev gcc

ENV AWS_DEFAULT_REGION us-east-1
COPY config.yml start.sh /aws/

CMD ["/aws/start.sh"]
Since we can configure the database credentials dynamically, we can easily use the same exporter each of our environments (pprd, prod, etc).
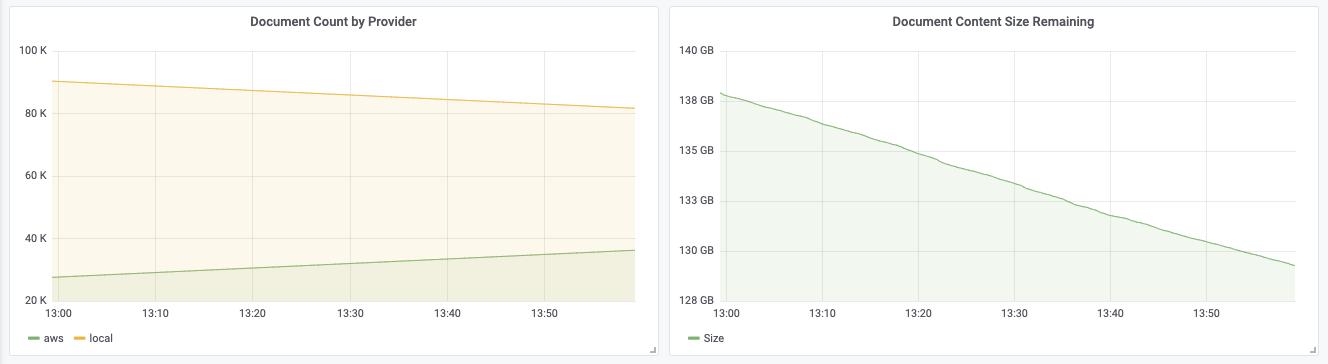
Then, time to deploy our container and configure Grafana! Pretty quick and easy! Here's a quick snapshot of our dashboard.
Anything missing or have questions? Comment below and let me know!